- Real document blocks
- Tables and headings stay selectable and printable.
- Live A4 preview
- What you see is what the PDF prints.
- Edit by chatting
- Change anything with one sentence.
- Free download
- No watermark, unlimited exports.
Everything a report needs to read well
Reports are built from the same real blocks as every other document, so structure is the default rather than something you fight into place.
Where they usually go wrong
It has to look like you do this for a living.
A Word file shows the seams: floating tables, mismatched type, spacing you fixed twice.
Template sites make you retype the job into their form.
Twelve fields before you see a page, and the result still looks like their template.
One change and the layout falls apart.
Move a line and the table, the headings, and the footer all need re-fixing.
- Tables for figures, right-aligned where the columns are numeric
- A title and a one-line context line
- Section headings that carry the argument
- A summary or findings section to close
| Metric | Previous | Current | Change |
|---|---|---|---|
| Revenue | $4.30M | $4.82M | +12% |
| Gross margin | 71% | 69% | -2 pts |
| Self-serve churn | 4.1% | 6.3% | +2.2 pts |
Download a two-page report with its source data
The downloadable example contains a KPI table on page one and a source appendix after an explicit page break. It is a deterministic recipe render with fictional data, not a live AI trial. Compare the PDF with its CSV: revenue rises from $4.30M to $4.82M (12.09%, rounded to 12%), margin falls from 71% to 69% (2 percentage points), and churn rises from 4.1% to 6.3% (2.2 percentage points).
Attach your CSV as a text file up to 200 KB, then ask for the period, units and original values to be preserved.
Check row counts, totals, rounding and missing values against the source; distinguish percentages from percentage points.
Use the preview's Page numbers switch if the exported report needs numbering.
Download the two-page report PDFDownload the source KPI CSVMonthly report structure and source checks
How it works
Describe it
Type what you need in plain language: the client, the line items, the tone. Attach a file if you have one.
Refine by chatting
The agent builds the document with real tables and headings, and you change anything just by asking. A live A4 preview updates as it works.
Download the PDF
Export a print-ready A4 PDF. No watermark on the free plan, and unlimited exports.
Free to start. No watermark.
See a finished report
Pick an example and the full PDF renders here in seconds. Download it if you like it, no sign-in needed.
Q3 sales report with a regional revenue table
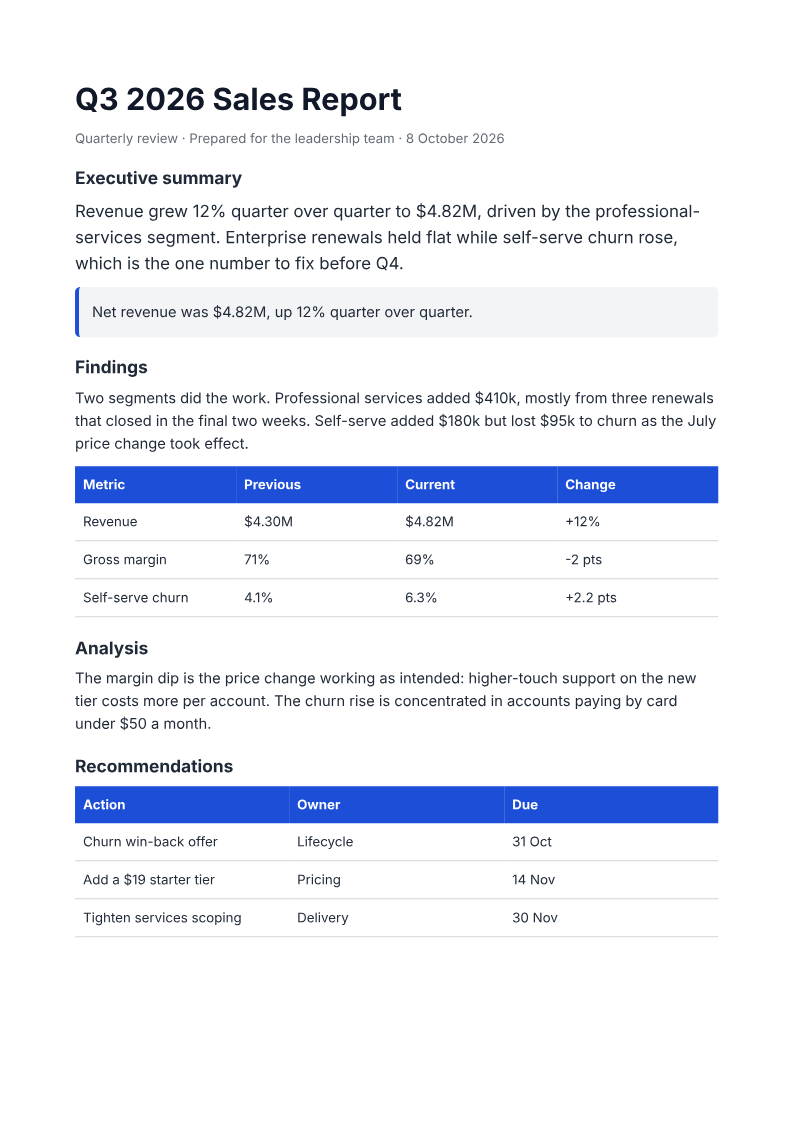
Like it? Open a copy in the studio and change anything by chatting. Free, no watermark.
Generate my reportYou type it, it sets it
Every part of the document is something you can ask for in a sentence. This is a real edit, made on the example above.
A fourth row in the recommendations, with owner and date.
| Action | Owner | Due |
|---|---|---|
| Churn win-back offer | Lifecycle | 31 Oct |
| Add a $19 starter tier | Pricing | 14 Nov |
Questions, answered
Will tables tear across a page break?
Reports can run several pages. Ask for an explicit page break before an appendix and inspect every page in the preview. The finish check flags stranded headings and split tables; a table taller than a page still has to split.
Can it make a multiple-page report?
Yes. Inspect each exported page: layout checks can flag split tables and stranded headings, but tables taller than a page must split. Checks do not validate your source data.
Does it do tables and charts?
Both. Tables right-align numeric columns automatically, and charts (bar, line, area, pie, donut) are built from [label, value] rows. A screenshot-style figure can still come in as an image block.
Is it free?
Free to start, no watermark, unlimited exports, around 20 PDFs a month on the free plan.
Reports it handles well
The generator is document-shaped rather than domain-specific, so the reports people bring it tend to fall into a few patterns:
- Status and progress updates: what shipped, what slipped, and what's next
- Monthly or quarterly business reviews: a KPI table with commentary
- Research or findings summaries: headed sections that build one argument
- Incident or post-mortem write-ups: a timeline table, then causes and actions
Turn rough notes into a report
Supply the audience, reporting period, source figures and decisions needed. Ask for an executive summary, KPI table, findings and owner/date next steps. Mark unknowns and hypotheses explicitly, then compare the export with the source. Formatting and layout checks do not verify the truth of the narrative.
How long does it take to build the report?
One short chat: describe what you need, check the live preview, download the PDF. You can keep changing it after that.
Can I bring a document I already have?
Yes. Attach up to four files at a time: images up to 5 MB, PDFs up to 10 MB, or text files up to 200 KB (.txt, .md, .csv, .json). For Word (.docx, not .doc), PDF, Markdown, HTML or LaTeX documents up to 10 MB each, choose ‘Import a document’ from the studio’s attachment menu. The agent rebuilds imports as editable blocks; original formatting may change.
Send a report that reads clean, page one to last
- Headings, tables, and figures laid out.
- Multi-page, with layout checks before export.
- Free to start, no watermark.
No credit card.