Monthly Report Template: Structure, Example and PDF
Short answer: A monthly report is a decision document, not a diary. Lead with what changed, put the numbers in a KPI table, explain the one thing that moved most, and end with what you'll do next. No page count — one page is often enough.
The worst monthly reports read like a list of everything the team touched. The best ones answer a single question: what should the reader do with this?
That shift — from activity to outcome — is most of the work. The rest is structure, which is the part you can hand to a tool.
Monthly report template
Copy this outline and replace the bracketed fields with your own verified information:
[Report name] — [Month and year]
Prepared for: [Audience] | Prepared by: [Owner] | Date: [Date]

Executive summary: [What changed, why it matters, decision needed]
KPI table: [Metric | Previous month | Current month | Change and unit]
Findings: [Observed change | Supporting evidence | Explanation or hypothesis]
Risks and blockers: [Risk | Impact | Mitigation]
Next steps: [Action | Owner | Due date]
Keep the comparison periods consistent. Label missing values and hypotheses instead of filling them with invented figures or explanations.
How to fill the template
1. Title and period
The report name, the period it covers, who it's for, and the date. One line. It sounds obvious; it's skipped constantly, and a report without an obvious period is untrustworthy.
2. Executive summary
The headline finding, in two or three sentences. If the reader stops here, they should still know whether the month was good and what's changing. Write this last, even though it appears first.
3. The KPI table
The numbers, in a table, with the previous period and the change. This is the section readers actually scan. Give it the columns they'll compare:
These are fictional monthly illustration values, not business results. The downloadable quarterly fixture below uses the same numbers with explicitly different period labels.
Right-align the numeric columns and the table becomes readable at a glance. Every change gets a sign and a unit; "+12%" is useful, "12" is not.
4. What happened, and why
One short section per thing that moved meaningfully — not every metric, the ones that matter. Say what changed and your best explanation of why. "Churn rose, concentrated in card-paying accounts under $50" is analysis; "churn was higher" is a restatement.
5. Risks and blockers
What's in the way, honestly. A monthly report that never contains a problem is not being read critically — it's being ignored.
6. Next month
Two or three specific intentions with owners and dates. This is what turns the report from a report into a plan, and it's what the next month's report gets measured against.
The AI shortcut
Most of the time goes into the page, not the thinking — getting the KPI table to align, the sections in order, the headings consistent month to month.
Describe the period and the numbers to the report generator and it builds the structure above on A4: a title block, an executive summary, a findings section, and a KPI table with right-aligned numeric columns. Layout checks help flag awkward breaks, but headings can strand and tables taller than a page can split. Inspect the exported pages before sending them.
Then iterate by asking: add a region column, split the churn line by plan, move the recommendations to the end. You're editing the report, not rebuilding it.
Or keep your own numbers and use it for the layout alone.
Example: a one-page monthly report
A tight monthly report doesn't need to be long. Something like:
- September 2026 monthly report — prepared for the leadership team, comparing August with September.
- Summary: revenue up 12%; self-serve churn up 2.2 percentage points.
- KPI table: revenue, margin, churn, with last month and change.
- Analysis: investigate the margin decline and churn increase; the KPI table alone does not establish their causes.
- Next month: review churn by cohort (Lifecycle, 14 Oct), assess pricing options (Pricing, 31 Oct).
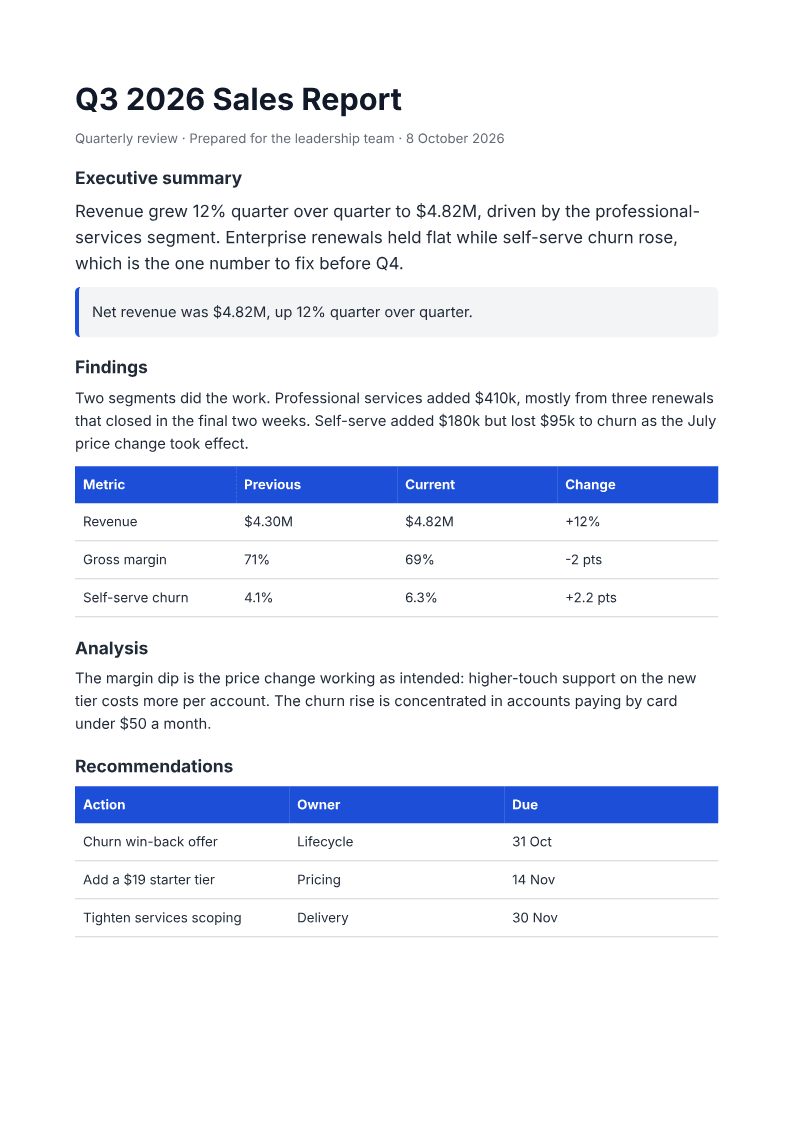
This is a fictional outline, not a rendered monthly fixture or a causal analysis. Keep it concise and check whether your own content fits on one page.
A two-page version and a CSV source check
Download the two-page report PDF and its source KPI CSV. This is a deterministic render of the report recipe with an explicit break before a source appendix. It demonstrates the renderer, not a live AI import or prompt-following test. Its narrative is fictional demo copy; the CSV alone does not establish the causes it describes.
To use your own data, attach a CSV up to 200 KB and ask the report generator to retain the period, units and source values. Compare the original and output row by row. Revenue from $4.30M to $4.82M is a 12.09% increase, rounded to 12%. A margin change from 71% to 69% is minus 2 percentage points, not minus 2%. Check missing values and totals too, and ask the agent to label hypotheses rather than invent causes.
For longer reports, ask for an explicit page break before the appendix and inspect both sides of each break. Tables taller than a page will split; the finish check can flag layout issues but does not validate your source data.
Frequently asked questions
How long should a monthly report be? As long as it takes to say what changed and what's next. Often one page. If it's running long, you're including activity rather than outcome.
Should I include every metric? No. Include the ones that matter to the reader and the ones that changed. A full dashboard belongs in a tool; a report is an argument about what to focus on.
What if the month was bad? Say so in the summary, explain what you know, and put the fix in next month's section. Reports that hide a bad month lose the reader's trust the moment they notice.
Can I automate the numbers? You can pull them from wherever they already live; the report is the narrative around them. The layout and the prose are what the generator handles, not the source data.
Describe the period and the numbers and PaintPDF formats a structured report PDF with headings, a KPI table and sections. Free to start, no watermark.
Open the report generator